Pandas Resample, Rolling, Shift, and Cumulative
python pandas resample rolling shift and cumulative calculations: Learn how pandas resample, rolling, shift, and cumulative calculations transform time-indexed data in...
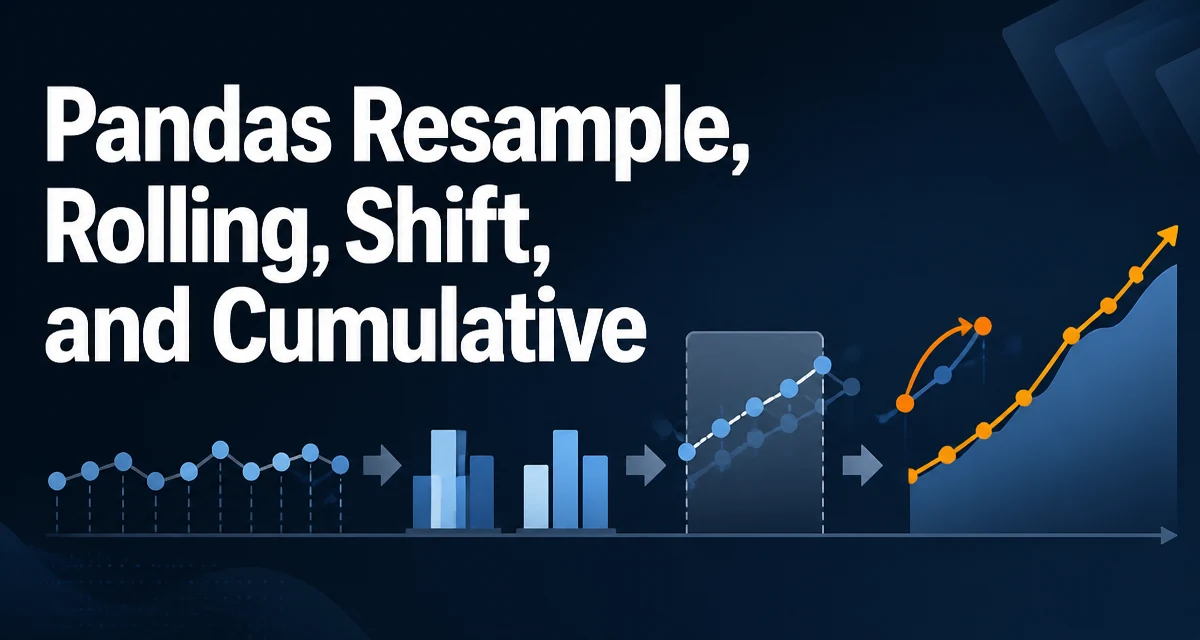
python pandas resample rolling shift and cumulative calculations requires a clear understanding of the core syntax, runtime behavior, and practical implementation patterns demonstrated in the examples below.
Python pandas resample, rolling, shift, and cumulative calculations are the four operations that handle most time series transformations in pandas. They solve different problems — frequency conversion, window aggregation, period comparison, and running totals — but they are usually used together in the same pipeline. Understanding what each one does, and how they interact, is the difference between writing a few clean vectorized lines and looping over rows manually.
Setting Up a Time Series DataFrame
All four operations work most naturally on a DatetimeIndex. Here is a minimal frame with hourly observations:
import pandas as pd
import numpy as np

idx = pd.date_range('2024-01-01', periods=96, freq='h')
df = pd.DataFrame({'value': np.random.default_rng(42).standard_normal(96).cumsum()}, index=idx)
The index is the backbone of these operations. If your data has a datetime column instead, convert it with pd.to_datetime() and set it as the index before calling resample or rolling. shift and cumsum work on any index, but they become time-aware when the index is a DatetimeIndex.
Resample: Converting Between Frequencies
resample changes the frequency of the index and applies an aggregation to each resulting bin. The most common use is downsampling from a fine frequency to a coarser one:
daily_sum = df.resample('D').sum()
weekly_mean = df.resample('W').mean()
monthly_max = df.resample('ME').max()
The rule string determines the target frequency: 'D' for day, 'W' for week, 'ME' for month-end, 'QE' for quarter-end, 'YE' for year-end, 'h' for hour, 'min' for minute. In pandas 2.2 and later, the 'M', 'Q', and 'Y' aliases are deprecated in favor of 'ME', 'QE', and 'YE'; older code using the short forms still runs but emits a warning.
Upsampling — going from daily to hourly, for example — requires a method to fill the missing values:
hourly = daily_sum.resample('h').ffill()
resample also accepts closed and label parameters that control which side of each bin is included and how bins are labeled. For most aggregation work the defaults are fine, but when you compare results across different sources, mismatched bin edges are a common source of subtle differences.
Rolling: Window-Based Aggregations
rolling applies an aggregation over a sliding window of consecutive rows. The window size is measured in rows unless the index is a DatetimeIndex and you pass a time-based offset string:
df['rolling_mean_24'] = df['value'].rolling(24).mean()
df['rolling_mean_24h'] = df['value'].rolling('24h').mean()
The first form uses the previous 24 rows; the second uses the previous 24 hours, which is different when the data has gaps or irregular spacing. min_periods controls how many non-NaN observations are required before a result is produced:
df['rolling_std'] = df['value'].rolling(24, min_periods=6).std()
With min_periods=6, the first five rows produce NaN, and the sixth row produces a standard deviation computed from six observations. This is useful at the start of a series where a full window is not yet available.
Shift: Comparing Values Across Periods
shift moves values forward or backward in time. The periods argument is positive for past values and negative for future values:
df['prev_value'] = df['value'].shift(1)
df['next_value'] = df['value'].shift(-1)
The most common pattern is computing a period-over-period change:
df['hourly_change'] = df['value'] - df['value'].shift(1)
diff() is a shortcut for exactly this operation, and pct_change() computes the relative change. When the index is a DatetimeIndex, you can also shift by a frequency offset instead of a row count:
df['yesterday_value'] = df['value'].shift(freq='D')
The freq form shifts by calendar time rather than row position, which matters when rows are missing or irregularly spaced.
Cumulative Calculations: Running Totals and Extremes
The cumulative family — cumsum, cumprod, cummax, cummin — computes a running value from the first row to the current row:
df['cumulative_sum'] = df['value'].cumsum()
df['cumulative_max'] = df['value'].cummax()
df['cumulative_min'] = df['value'].cummin()
cumsum is the standard running total. cummax and cummin track the highest and lowest values seen so far, which is useful for drawdown analysis or threshold detection. These operations are vectorized and do not require a DatetimeIndex, but when combined with resample or rolling they inherit the time-aware grouping.
Combining the Four Operations in a Realistic Pipeline
A typical pipeline downsamples to a daily frequency, computes a rolling average, compares against the previous day, and tracks a running total:
daily = df.resample('D').sum()
daily['rolling_7d'] = daily['value'].rolling(7, min_periods=3).mean()
daily['prev_day'] = daily['value'].shift(1)
daily['daily_change'] = daily['value'].diff()
daily['cumulative'] = daily['value'].cumsum()
The order matters. resample must come first because it changes the index frequency; rolling and shift then operate on the resampled series. If you apply rolling before resample, the window is measured in the original hourly rows, which is a different semantic.
Performance and Memory Considerations
All four operations are vectorized in pandas and avoid Python-level loops. resample and rolling allocate intermediate structures proportional to the number of bins or windows, so memory usage grows with the size of the input. shift is cheap: it reindexes the values without copying the underlying data. Cumulative operations are single passes and are the least expensive of the four.
The main performance trap is calling these operations inside a Python for loop over groups. If you need per-group rolling or cumulative calculations, use groupby(...).rolling(...) or groupby(...).cumsum() instead of iterating:
grouped = df.groupby('group')['value'].cumsum()
This keeps the work inside pandas' compiled code.
Common Pitfalls with Time-Based Operations
Several failures show up repeatedly when these operations are combined.
A DatetimeIndex is required for resample. If the index is a regular RangeIndex, resample raises a TypeError. Convert the datetime column first with pd.to_datetime().
shift with freq and shift with periods are not interchangeable. periods shifts by row position; freq shifts by calendar time. With missing rows, the two produce different results.
rolling with a time-based window like '24h' counts observations within the time span, not the last 24 rows. If your data has gaps, the window may contain fewer than 24 observations, and min_periods determines whether the result is NaN or a partial-window value.
Finally, timezone-aware indices require consistent timezone handling. Mixing naive and aware datetimes in the same index raises an error. If your data arrives in UTC and you need local-time buckets, convert the entire index with tz_convert() before calling resample.