Python Plotly vs Matplotlib: How to Choose
python plotly vs matplotlib: Compare Python Plotly and Matplotlib for data visualization: API differences, interactivity, performance, and when to choose each library...
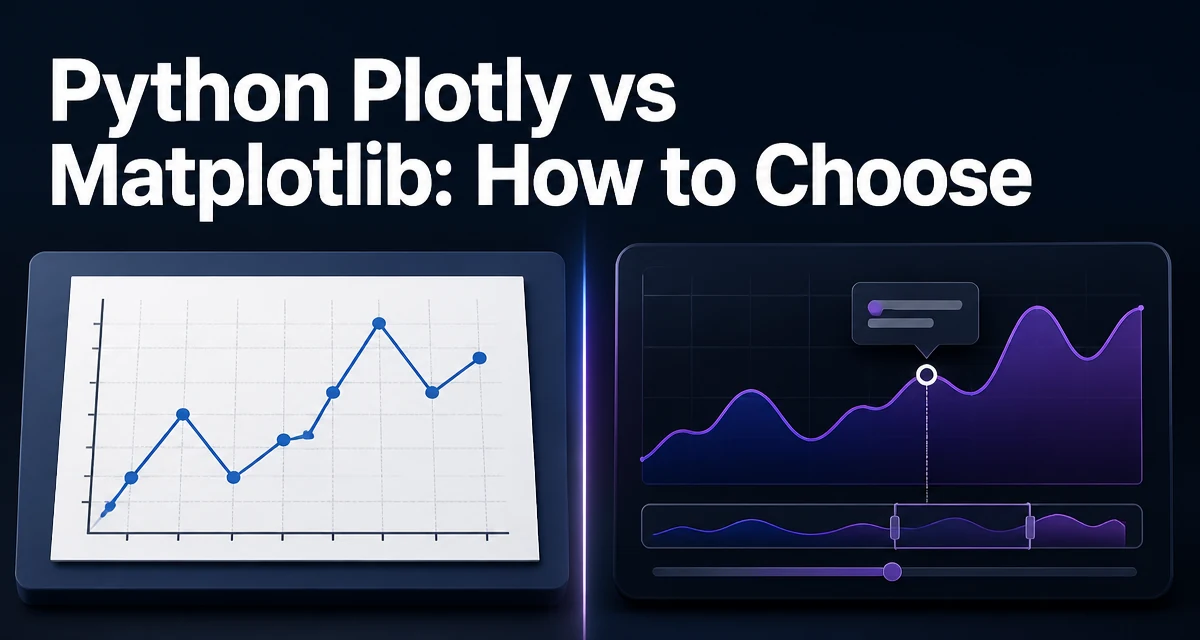
When you need to produce a chart in Python, python plotly vs matplotlib is a decision that comes up early in almost every data project. Both libraries are mature, widely used, and capable of producing publication-quality figures. But they approach plotting from fundamentally different angles, and the right choice depends on whether you need a static image for a report or an interactive figure that users can explore in a browser.
The most immediate difference is API design. Matplotlib uses a stateful interface through pyplot, where you call functions like plt.plot() and plt.xlabel() that mutate a global figure state. Plotly, in contrast, is object-oriented: you create Figure and Trace objects, configure them explicitly, and then render them. This distinction shapes how you write, debug, and reuse plotting code.
The Core Difference: Stateful vs Object-Oriented API
Matplotlib's pyplot module maintains an implicit current figure and axes. This makes quick interactive exploration easy, but it can become confusing when you generate multiple figures in a loop or inside functions. Consider a simple line plot:
import matplotlib.pyplot as plt

x = [1, 2, 3, 4]
y = [10, 20, 25, 30]

plt.plot(x, y)
plt.xlabel('X axis')
plt.ylabel('Y axis')
plt.title('Matplotlib Example')
plt.show()
Every call after plt.plot() applies to the same global axes. If you create a second figure without calling plt.figure(), you risk drawing on the previous one. This implicit state is convenient for small scripts but can lead to subtle bugs in larger codebases.
Plotly requires you to build a figure explicitly:
import plotly.graph_objects as go

fig = go.Figure()
fig.add_trace(go.Scatter(x=x, y=y, mode='lines+markers'))
fig.update_layout(
    title='Plotly Example',
    xaxis_title='X axis',
    yaxis_title='Y axis'
)
fig.show()
Here, every element is attached to a named Figure object. You can reuse and modify fig without worrying about global state. This object-oriented approach makes Plotly code more predictable when you build complex dashboards or embed figures in web applications.
Output Formats: Static Files vs Interactive HTML
Matplotlib renders to static formats: PNG, SVG, PDF, and EPS. These are ideal when you need a high-resolution image for a paper, a slide, or a document. The rendering is deterministic and does not require a web browser or JavaScript. You can also save figures to file with plt.savefig('output.png', dpi=300).
Plotly's default output is an HTML file that includes JavaScript for interactivity. When you call fig.show(), it opens a browser tab with a plot that supports hover tooltips, zooming, panning, and toggling traces. You can also save it as a standalone HTML file with fig.write_html('output.html'). Plotly can export static images too, but that requires additional dependencies like kaleido or an external service, and the result is a snapshot of the interactive figure.
The choice of output format directly affects your workflow. If your deliverable is a static image embedded in a report, Matplotlib is simpler and more reliable. If you need an interactive exploration tool, Plotly's HTML output is far more convenient than trying to add interactivity to a Matplotlib figure manually.
Interactivity and Dashboard Integration
Plotly was designed with interactivity as a core feature. Its figures support hover labels, zoom, pan, and linked selections out of the box. You can also add sliders, dropdown menus, and animation frames with update_layout and update_traces. This makes Plotly a natural fit for dashboards built with Dash, Plotly's web framework, or for embedding in Jupyter notebooks where users expect to inspect data points.
Matplotlib also has an interactive backend for use in Jupyter notebooks, but it is limited to basic zoom and pan within the notebook environment. There is no built-in mechanism to create a standalone interactive HTML file without additional libraries like mpld3 or plotly itself. If your goal is a self-contained interactive chart, Plotly is the more direct path.
For example, a Plotly figure can include a slider that filters data by year with just a few lines of code:
import plotly.express as px

df = px.data.gapminder()
fig = px.scatter(df, x="gdpPercap", y="lifeExp", animation_frame="year")
fig.show()
This produces an animated scatter plot with a play button. Reproducing that in Matplotlib would require manually building a widget or embedding in a GUI toolkit, which is significantly more work.
Performance and Memory Overhead
Matplotlib is generally faster for rendering large static datasets because it draws directly to a canvas and does not need to serialize data into a web-friendly format. For a scatter plot with millions of points, Matplotlib can render a PNG in a fraction of a second, whereas Plotly must transfer the data to the browser and use JavaScript to draw the plot, which introduces overhead in both memory and latency.
Plotly's interactive figures store all data in the HTML or in a browser-side data structure. For very large datasets, this can make the HTML file huge and the browser sluggish. You can mitigate this by downsampling or using Plotly's scattergl trace type, which uses WebGL for faster rendering, but it still requires the data to be present in the browser.
In practice, the performance difference matters when you are working with millions of points or when you need to generate hundreds of plots in a batch. For typical data exploration with thousands of points, both libraries are responsive enough, and the choice should be based on the output format and interactivity requirements rather than raw speed.
Integration with Pandas and Jupyter
Both libraries integrate well with Pandas DataFrames. Matplotlib works directly with DataFrame columns via df.plot() which is a thin wrapper around pyplot. Plotly Express provides a higher-level API that accepts DataFrames and automatically maps column names to axes, colors, and hover data. For example:
import plotly.express as px

fig = px.scatter(df, x="gdpPercap", y="lifeExp", color="continent")
This one-liner creates a colored scatter plot with hover labels. The equivalent in Matplotlib requires more manual code:
import matplotlib.pyplot as plt

for continent, group in df.groupby("continent"):
    plt.scatter(group["gdpPercap"], group["lifeExp"], label=continent)
plt.legend()
Plotly Express is more concise for common chart types, but Matplotlib's lower-level API gives you finer control over every visual element. In Jupyter notebooks, both work well: Matplotlib renders static PNGs inline, while Plotly renders interactive HTML that you can hover over and zoom.
Choosing Between Plotly and Matplotlib
The decision comes down to the final use case, not personal preference. Use Matplotlib when:
- You need a static image for a publication, report, or slide.
- You are working with extremely large datasets that would overwhelm a browser.
- You want deterministic, pixel-perfect output without any JavaScript dependency.
- You are building a script that generates hundreds of charts for batch processing.
Use Plotly when:
- You need interactive features like hover, zoom, and pan for exploratory analysis.
- You are building a web dashboard or an application that embeds charts.
- You want to share a self-contained HTML file that others can open in a browser.
- You prefer a more declarative, object-oriented API that scales to complex figures.
There is also a middle ground: you can use Matplotlib for static figures and Plotly for interactive ones within the same project. Many data teams do exactly that, using Matplotlib for final report images and Plotly for internal exploration dashboards.
A Side-by-Side Code Comparison
To see the practical differences, here is the same scatter plot created with both libraries using a sample dataset.
Matplotlib version:
import matplotlib.pyplot as plt
import pandas as pd

df = pd.read_csv("data.csv")
plt.scatter(df["x"], df["y"], c=df["category"], cmap="viridis")
plt.colorbar(label="Category")
plt.xlabel("X")
plt.ylabel("Y")
plt.title("Scatter Plot")
plt.savefig("scatter.png", dpi=150)
Plotly version:
import plotly.express as px

fig = px.scatter(df, x="x", y="y", color="category", title="Scatter Plot")
fig.write_html("scatter.html")
The Plotly version is shorter and produces an interactive HTML file. The Matplotlib version gives you a static PNG. Both are valid, but they serve different purposes. If you need to embed the chart in a web page, the Plotly HTML can be included directly. If you need to include it in a PDF report, the PNG is more straightforward.
Deployment and Maintainability Considerations
When you deploy a Python application that generates plots, the choice of library affects your infrastructure. Matplotlib is a pure Python library that runs anywhere Python runs. It does not require a web server or a browser. You can generate charts in a background worker and store them as files or serve them as static assets. This makes it easy to integrate into existing data pipelines.
Plotly, on the other hand, is often used in web applications. If you use Dash, you need a web server and a way to serve the interactive components. Plotly figures can also be embedded in existing web apps by rendering the HTML, but that requires a front-end that can handle the JavaScript. For server-side generation, you can save Plotly figures as HTML files and serve them as static content, but that bypasses the dynamic interactivity that Plotly offers.
Maintainability also differs. Matplotlib's stateful API can lead to code that is harder to refactor, especially when you reuse plotting code across modules. Plotly's explicit object model makes it easier to build reusable chart functions that return Figure objects, which you can then modify or combine. If you are building a library that other developers will use, Plotly's API is often more predictable.
One common pitfall is mixing the two libraries in the same project. Both can coexist, but you need to be careful about imports and naming conflicts. For example, both matplotlib.pyplot and plotly.graph_objects use show() methods, but they behave differently. In a Jupyter notebook, calling plt.show() will display a static image, while fig.show() will render an interactive widget. Keeping the two separate in your codebase reduces confusion.
Finally, consider the long-term evolution of your project. If you expect to add more interactive features later, starting with Plotly avoids a rewrite. If your charts are always static and you need fine-grained control over every pixel, Matplotlib gives you that control without the overhead of a web-based rendering engine. The choice is not permanent; you can always switch, but it is easier to start with the library that matches your primary output format.