Python ReportLab Canvas vs Platypus
python reportlab canvas vs platypus: Compare ReportLab Canvas and Platypus for PDF generation: imperative drawing vs document flow, and decide which API fits your use...
When you need to generate a PDF in Python, ReportLab offers two distinct APIs: Canvas and Platypus. The choice between python reportlab canvas vs platypus determines how you structure your code, how much control you have over layout, and how much effort you spend on document flow. This article compares the two approaches and explains when each one is the better fit.
The Core Difference: Imperative Drawing vs. Document Flow
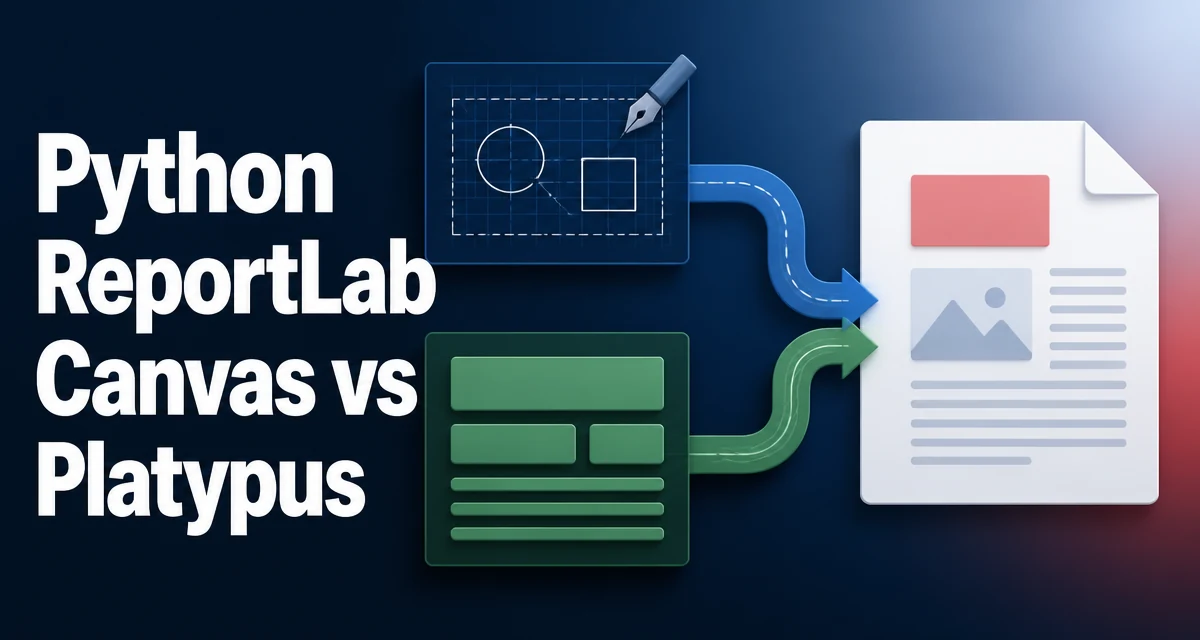
ReportLab's Canvas API is a low-level drawing surface. You specify exact coordinates, draw shapes, place text at fixed positions, and control every pixel. Platypus, short for "Page Layout and Typography Using Scripts," works at a higher level. You define a document flow of flowables—paragraphs, tables, images, spacers—and Platypus handles page breaks, alignment, and layout automatically.
Here is a minimal Canvas example that draws a rectangle and some text:
from reportlab.pdfgen import canvas

c = canvas.Canvas("example.pdf")
c.rect(100, 700, 200, 100)
c.drawString(110, 750, "Canvas text")
c.save()
The same output using Platypus requires a document template and a story:
from reportlab.lib.pagesizes import letter
from reportlab.platypus import SimpleDocTemplate, Paragraph, Spacer
from reportlab.lib.styles import getSampleStyleSheet

doc = SimpleDocTemplate("example.pdf", pagesize=letter)
story = []
style = getSampleStyleSheet()["Normal"]
story.append(Paragraph("Platypus text", style))
story.append(Spacer(1, 20))
doc.build(story)
The Canvas version gives you direct control over placement. The Platypus version lets you focus on content structure and lets the framework manage the page.
When Canvas Is the Right Choice
Canvas is the right tool when you need precise, pixel-level control over the output. This includes drawing vector graphics, creating custom charts, adding watermarks, or positioning elements at exact coordinates. If your PDF is essentially a drawing—like a technical diagram, a map, or a certificate—Canvas gives you the flexibility to place every element exactly where you want it.
Canvas also works well when you are generating a single-page document with a fixed layout, such as a ticket, a label, or a simple form. You do not need automatic pagination because the content fits on one page. In these cases, the imperative style of Canvas is straightforward and avoids the overhead of Platypus's document framework.
One important limitation of Canvas is that it does not automatically handle text wrapping or page breaks. If you draw a long paragraph with drawString, the text will simply overflow the page. You must measure text width, split it manually, or use drawText with a TextObject and manage line breaks yourself. That makes Canvas a poor fit for text-heavy documents.
When Platypus Is the Right Choice
Platypus is designed for documents that consist of flowing content: reports, invoices, manuals, and multi-page documents. You build a story of flowables, and Platypus decides where to break pages, how to keep headings with paragraphs, and how to lay out tables across pages.
The main advantage of Platypus is that it handles pagination and layout automatically. You do not need to calculate y-coordinates or check whether content fits on the current page. Platypus also provides a rich set of flowables, including Paragraph, Table, Image, PageBreak, and Spacer, which cover most document needs.
Here is a more realistic Platypus example with a heading and a table:
from reportlab.lib.pagesizes import letter
from reportlab.platypus import SimpleDocTemplate, Paragraph, Table, Spacer
from reportlab.lib.styles import getSampleStyleSheet

doc = SimpleDocTemplate("report.pdf", pagesize=letter)
story = []
styles = getSampleStyleSheet()

story.append(Paragraph("Quarterly Report", styles["Title"]))
story.append(Spacer(1, 12))

data = [["Product", "Revenue"],
        ["Widget", "$1,200"],
        ["Gadget", "$3,400"]]
table = Table(data)
story.append(table)

doc.build(story)
Platypus also supports custom page templates and frames, so you can define headers, footers, and multiple columns without manually drawing them on each page.
Mixing Canvas and Platypus in One Document
You do not have to choose one API for an entire document. ReportLab allows you to use Canvas drawing inside a Platypus flow by creating a custom flowable. This is useful when you need precise vector graphics, such as a chart or a signature, inside an otherwise flowing document.
A common pattern is to subclass Flowable and override its draw method:
from reportlab.platypus import Flowable

class RectangleFlowable(Flowable):
    def __init__(self, width, height, color):
        super().__init__()
        self.width = width
        self.height = height
        self.color = color

    def draw(self):
        self.canv.setFillColor(self.color)
        self.canv.rect(0, 0, self.width, self.height, fill=1, stroke=0)
You can then add this flowable to a Platypus story, and Platypus will place it in the document flow while still letting you use Canvas drawing commands inside the draw method.
This hybrid approach is the best of both worlds: Platypus handles pagination and text flow, and Canvas handles the parts that require exact geometry.
Performance and Memory Considerations
The performance difference between Canvas and Platypus is rarely the deciding factor for typical PDF generation. Both APIs ultimately produce a PDF file, and the time spent in Python code is usually small compared to the time spent in the PDF renderer. However, there are some operational differences worth understanding.
Canvas is more memory-efficient for very large drawings because you are directly writing to the PDF canvas without building an intermediate document tree. Platypus, on the other hand, keeps the entire story in memory until doc.build() is called. If you are generating a document with tens of thousands of flowables, the memory footprint can become significant. In such cases, you may need to process the story in chunks or use a lower-level approach.
For most documents—reports, invoices, manuals—the memory usage of Platypus is negligible. The bigger performance concern is often the number of flowables and the complexity of table layouts. Tables with many rows or columns can slow down layout because Platypus must calculate column widths and row heights. If you have a very large table, consider splitting it into multiple tables or using a simpler layout.
Maintainability and Code Organization
The choice between Canvas and Platypus also affects how maintainable your PDF generation code is. Canvas code tends to be imperative and tightly coupled to coordinates. A change in layout often requires recalculating positions and updating many drawString or rect calls. This makes Canvas code harder to refactor and more error-prone when the document structure changes.
Platypus code is more declarative. You describe what content should appear, not where it should appear. This makes it easier to add or remove sections, change the order of content, and reuse flowables across documents. The separation between content and layout also makes it easier to test individual flowables in isolation.
If you are building a PDF generator that will evolve over time, Platypus is usually the better foundation. Canvas is better when the layout is fixed and unlikely to change, such as a one-off diagram or a certificate template.
Common Pitfalls and How to Avoid Them
One frequent mistake with Canvas is forgetting to call showPage() when you want to start a new page. Without it, all drawing commands go to the same page. In Platypus, you typically use a PageBreak flowable or let the framework break pages automatically, so this is less of an issue.
Another pitfall is mixing coordinate systems. Canvas uses a coordinate system with the origin at the bottom-left corner of the page, while Platypus flowables are positioned relative to the current frame. When you create a custom flowable, remember that the draw method receives a canvas with the origin at the bottom-left of the flowable's allocated area. This is different from the absolute page coordinates you might be used to from a standalone Canvas.
Text handling is another area where the two APIs diverge. Canvas's drawString does not wrap text, so you must measure string widths and break lines manually. Platypus's Paragraph handles wrapping and alignment automatically, but it requires a style object. If you need precise control over typography, Canvas gives you more options, but you pay for that control with more code.
Decision Guide: Canvas or Platypus for Your Use Case
The decision between Canvas and Platypus comes down to the nature of the document you are generating.
Use Canvas when:
- You need exact coordinates and pixel-level control.
- The document is a drawing, diagram, or single-page graphic.
- You are embedding vector graphics or custom shapes.
- You want to avoid the overhead of a document framework for a one-off script.
Use Platypus when:
- The document is text-heavy and multi-page.
- You need automatic page breaks, headers, and footers.
- You want to build a reusable document template.
- You prefer a declarative approach that separates content from layout.
For most business documents, Platypus is the more maintainable choice. Canvas remains essential for the parts that require precise geometry, and you can combine both APIs in a single document when needed.